Diagnostics [Tab 99]
This display shows diagnostic information about the console. Diagnostics can be opened via Browser > Setup, or via [Tab] [9][9].
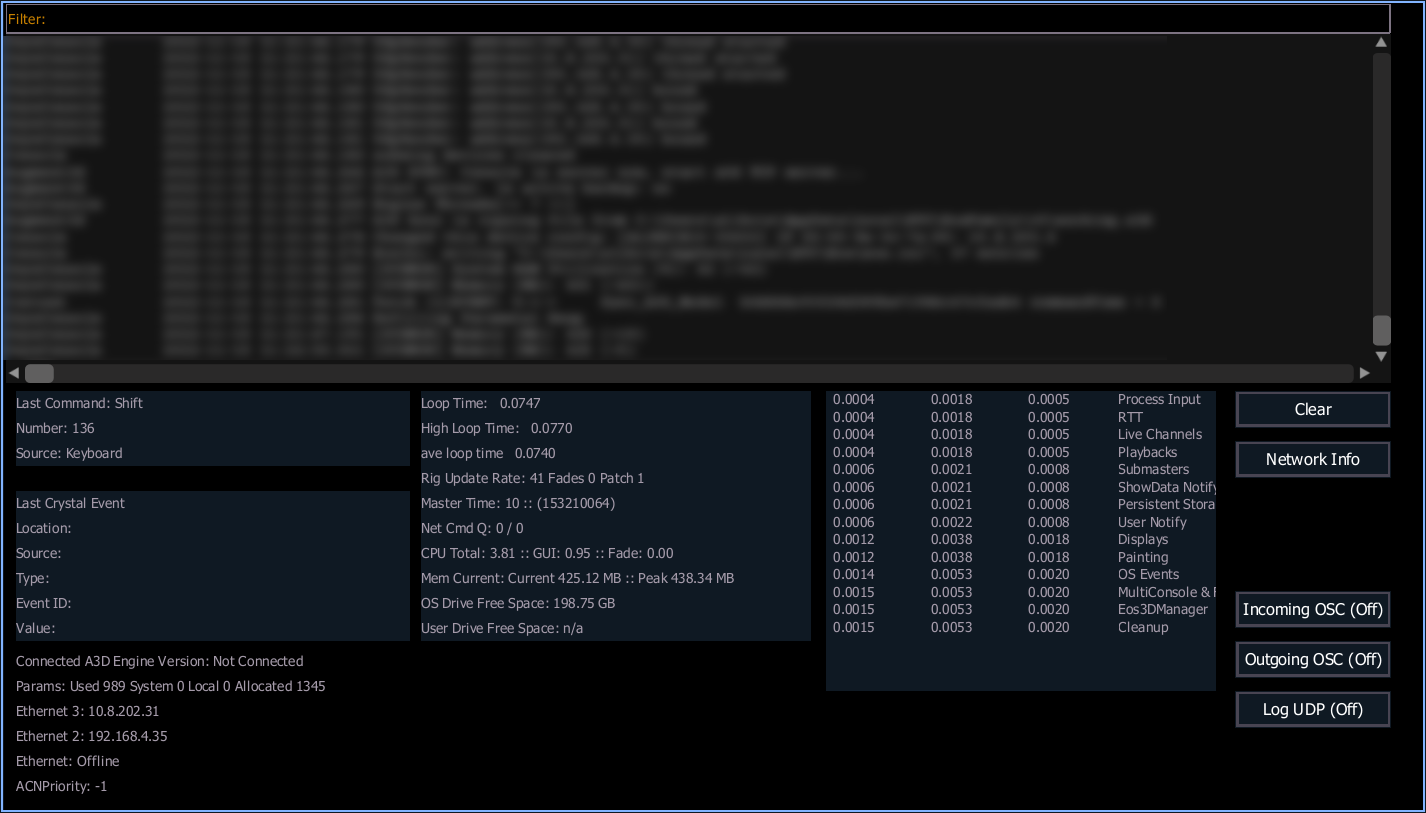
The diagnostics display is divided into the following areas:
Command Feed
All logged internal and external actions appear in the scrollable command feed at the top of the diagnostics display, with new logs at the top. The list can be searched by typing in the Filter box above the feed.
Diagnostic Information
Additional software, hardware, and network information is displayed in the live-updating fields below the command feed.
Device Health
The device health graph indicates the status of the console.
The live graph shows an ongoing 30-second window of the following health metrics:
- DMX Output - elapsed time since the last DMX output packet was sent in milliseconds (ms). Values above 24 for extended periods may result in dropped packets.
- Fade Engine Tick - elapsed time between fade engine ticks (refreshes) in milliseconds (ms).
- Network Queue - the number of queued commands from the multi-console Host waiting to be executed.
- Packet Errors - the number of packets received with ACN NAK errors. Higher values may indicate network issues.
The solid line indicates the peak observed value for a metric. The darker line indicates the average of all observed values.
Diagnostic Controls
The following buttons are available on the right side of the display:
- {Clear} - clears the list of logged items.
- {Network Info} - adds current network information to the logs.
- {Incoming OSC} - toggles incoming OSC on or off. Off by default.
- {Outgoing OSC} - toggles outgoing OSC on or off. Off by default.
- {Log UDP} - toggles UDP logging on or off. On by default.
- {Profiler} - toggles profiler logging on or off. Off by default.
- {Profiler Export} - save profiler information to disk.